Physical Address
304 North Cardinal St.
Dorchester Center, MA 02124
Physical Address
304 North Cardinal St.
Dorchester Center, MA 02124

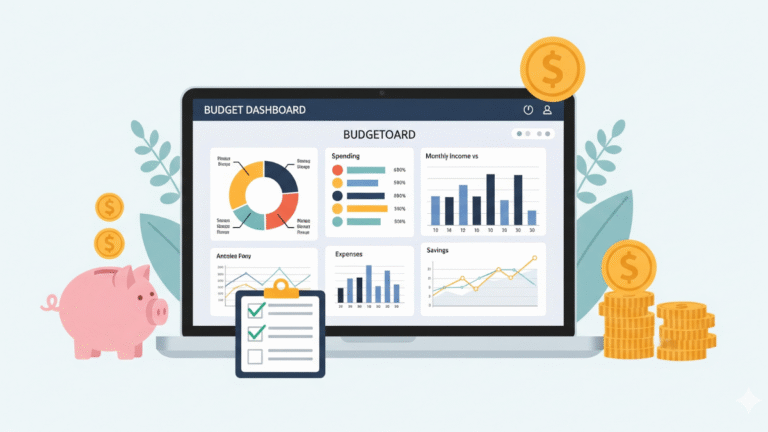
What gets measured gets managed.” You have probably heard that before, and it is true with investing. A portfolio budget statement turns messy accounts into a simple, forward-looking plan you can follow. In the next few minutes, you will see how to map your accounts, set a target asset allocation, forecast contributions, plan for fees and taxes, and create a twelve month budget that keeps your investments on track. The goal is control and calm, not guesswork. We will walk through a practical template, real numbers, and a repeatable review process so you can grow your money with fewer surprises.
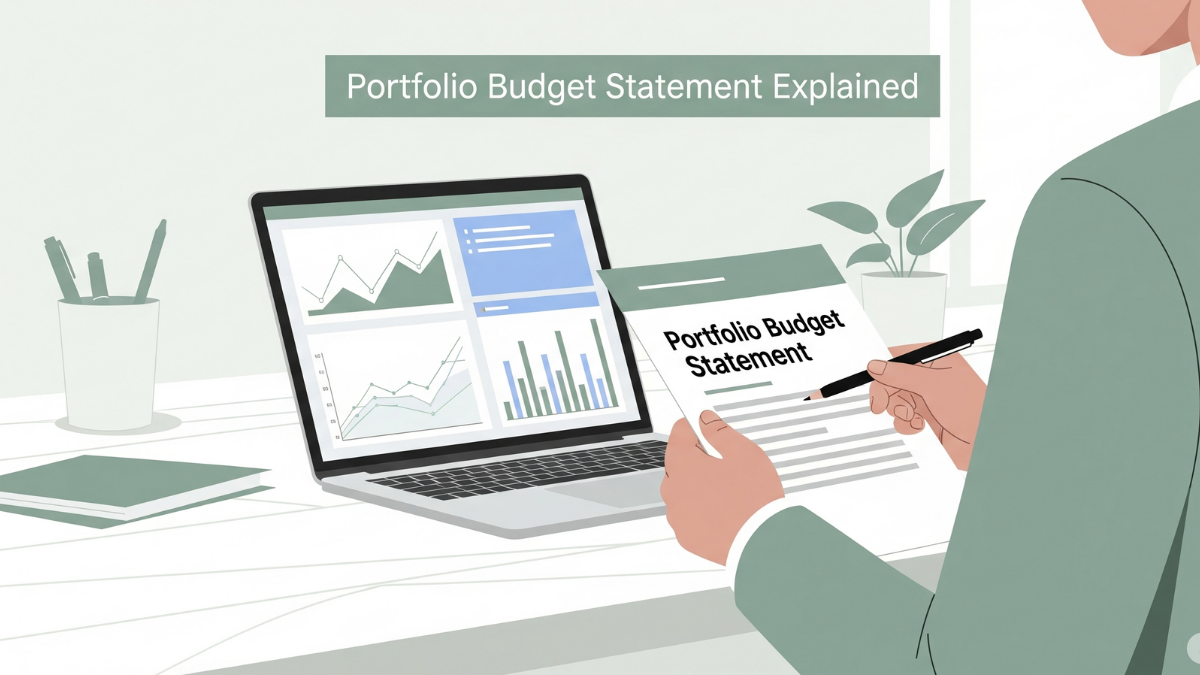
A portfolio budget statement is basically your money’s roadmap. It’s a document that lays out where your investments are, how much cash is coming in, what’s going out, and where you expect things to land by the end of the year. Think of it as part spreadsheet, part accountability partner. It’s not the same as an investment policy statement, which is more about rules and philosophy. And it’s not a household budget either, which deals with groceries, rent, and Netflix bills. Instead, this one zooms in on your portfolio and answers: Are my investments doing what I need them to do?
When I first built mine, I was surprised how much I was missing. For example, I had set allocations in my head like 70% stocks, 30% bonds, but when I ran the numbers, I was closer to 85/15 because of drift. Without a statement, I would have kept assuming I was “on track.” That’s why the definition matters: it’s a living snapshot of the truth, not what you think is happening.
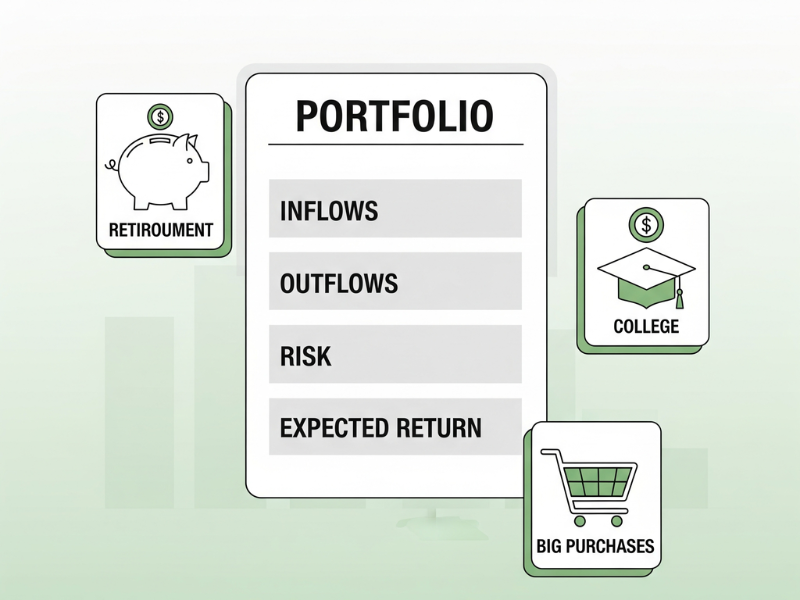
At its core, a portfolio budget statement tracks four things: inflows, outflows, allocation, and expectations.
Here’s where it gets practical. If you’re saving for retirement, your portfolio budget statement shows whether your current contributions line up with your goal timeline. For a college fund, it can highlight when you need to shift from growth assets into safer bonds. If you’re planning for a big purchase, like a down payment, it shows how much you can safely pull without derailing long-term growth. Having that clarity helps you avoid scrambling when the actual expense shows up.
Numbers don’t lie, but emotions often do. One of the best parts of using this tool is how it reduces emotional trading. When the market dips, instead of panicking, I check my statement. If my target allocation is still fine, I don’t touch a thing. If I’m overweight in stocks, I rebalance with discipline. It also adds a layer of accountability, if I skip contributions for a few months, it shows up in black and white. That sting alone has nudged me back into consistent investing more than once.
In short, a portfolio budget statement isn’t about making things complicated. It’s about creating a clear, structured view that helps you stay calm, consistent, and focused on the big picture.
Before I even touch numbers or spreadsheets, I like to get super clear on my goals. You can’t budget a portfolio effectively if you don’t know what it’s for. I’ve made the mistake of just throwing money into accounts, thinking “growth will happen,” but without goals, I had no idea whether my portfolio was actually on track.
Start by writing down your goals and when you want to reach them. Retirement? College tuition? A house? Assign each goal a time horizon. For instance, my “vacation fund” is short-term, two years, while my retirement is 25 years away. Once you know the timeline, you can work backwards to figure out how much cash you need to allocate each month. I use a simple spreadsheet to calculate monthly contributions, factoring in expected returns, so I can see if I’m under- or over-shooting.
It helps to define measurable outcomes. For me, success metrics include portfolio value targets, income targets, and maximum drawdown limits. When I first started, I ignored drawdowns and learned the hard way: seeing a 20% drop without a plan was nerve-wracking. Now, I define limits, so I know when to rebalance or hold steady. Metrics like these keep me honest and focused.
Next, link each goal to the right accounts and asset types. Retirement goes into tax-advantaged accounts, while a down payment might sit in a safer taxable account or cash equivalent. I also assign a rough asset class mix to each goal: stocks for long-term growth, bonds or cash for short-term needs. Mapping like this ensures that when one goal needs cash, it doesn’t derail another.
Risk isn’t one-size-fits-all. I’ve realized that some goals can handle more risk than others. My retirement portfolio is aggressive, but my emergency fund is rock solid in cash and short-term bonds. Ask yourself: how much volatility can each goal tolerate? How would a market dip affect your plans? Aligning risk tolerance with your actual capacity keeps your portfolio in check and prevents panic selling.
By the end of this step, you should have a clear framework: each goal has a timeline, a target, an assigned account, an asset allocation, and a risk level. It’s the blueprint that informs every number you’ll enter into your portfolio budget statement. When I followed this process, suddenly my investing wasn’t random, it had purpose and direction.
Once your goals are clear, it’s time to gather all the raw numbers. I can’t stress enough how much easier it is to make decisions when everything is in front of you. In the past, I tried estimating balances and returns from memory, and let’s just say I made some painful assumptions. Having actual data saved me from major headaches.
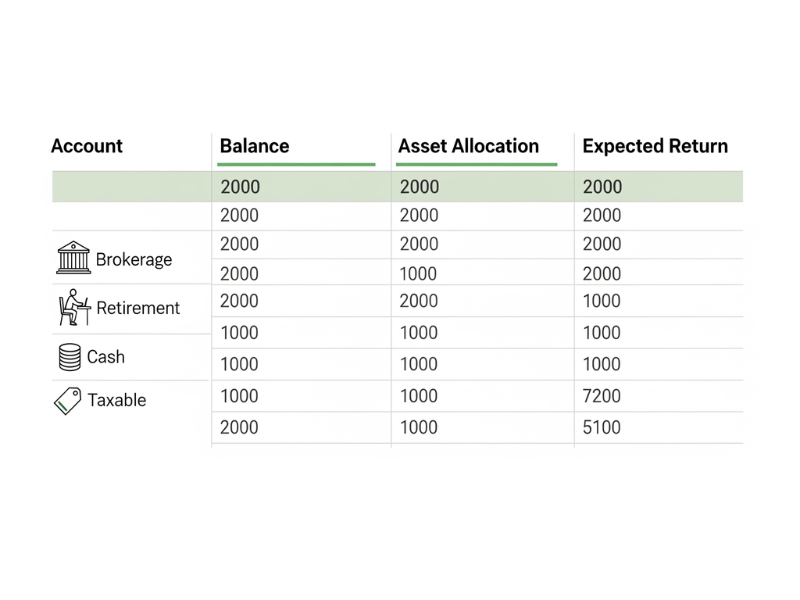
First, list every account you own. I have a mix: brokerage accounts, a 401(k), a Roth IRA, a small trust account, and a taxable cash account. If you miss one, your projections are off. Include even small balances, sometimes they surprise you when you see the total picture.
Next, record the current balance of each account and the asset allocation. Don’t just guess “about 60% stocks.” Check the actual percentages, stocks, bonds, cash, alternatives. I once thought I had a balanced allocation, only to realize a single tech fund had thrown my stock allocation way higher than intended. This snapshot will be your baseline for tracking progress and rebalancing later.
Now, estimate expected returns for each asset class. Include dividend yields, interest, and coupon payments. I like to use conservative assumptions; early in my investing journey, I overestimated returns and felt crushed when reality didn’t match. Be realistic, underpromise and overdeliver.
Fees can silently eat into your returns. Make a note of fund expense ratios, any advisory fees, and typical trading costs. I’ve learned that even a 1% fee on a large portfolio can add up to thousands over time. Include these costs in your statement so you see the true net returns.
Finally, consider taxes. Taxable accounts, retirement accounts, trusts, they all behave differently. I like to estimate capital gains tax, dividend withholding, and ordinary income taxes for each account. Doing this helps me plan withdrawals more efficiently and avoid nasty surprises.
Collecting all these inputs may feel tedious, but trust me, this step is the backbone of your portfolio budget statement. Once you have accurate data, building projections and planning allocations becomes straightforward. Plus, it makes your future self-thankful when market fluctuations come, you’ll know exactly where you stand.
Once all your data is in hand, it’s time to build the actual template. Think of this as creating a cockpit for your portfolio, everything you need to see at a glance should be in one place. The first time I set this up, I went a bit overboard with extra tabs and fancy formulas, but I quickly learned that simplicity beats complexity every time.
Start by setting up columns for each key metric. I use: account name, asset class, starting balance, target weight, expected return, planned contributions, expected withdrawals, fees, taxes, and ending balance. This lets me see the full story of each account and how it contributes to my overall plan.
Decide how granular you want your updates. I personally track monthly for cash flows and quarterly for big-picture changes like asset allocation drift. Monthly tracking keeps me honest with contributions and withdrawals, while quarterly checks prevent me from obsessing over short-term market noise.
Use formulas to calculate projected balances. For example, ending balance = starting balance + contributions + income – withdrawals – fees – taxes + growth. When I first did this, I realized how much fees and taxes quietly erode returns. Seeing the numbers laid out really motivated me to optimize.
Finally, add a summary section or dashboard. Include total portfolio value, overall allocation percentages, net contributions, and variance from target. I like to use simple color coding, green for on target, amber for slightly off, red if it’s way out. This makes it super easy to see what needs attention at a glance.
Creating this template was a game changer for me. Before I had it, I was guessing whether I was on track; now, I can see where every dollar is allocated, where it’s growing, and how fees and taxes affect progress. It turns a lot of abstract investing concepts into concrete, actionable numbers.
Once your template is set, the next step is deciding where your money should live. This is where your target allocation comes into play. I learned the hard way that letting allocations drift too far from your plan can quietly increase risk. Back in the day, my stock-heavy tech fund ballooned, and I had no rules in place, panic selling almost happened! That’s why defining targets and bands is essential.
Start by picking a strategy that matches your goals and risk tolerance. I usually go with a core index approach for simplicity, but some folks prefer a factor tilt (like value or momentum) or an income tilt for dividend-heavy portfolios. The key is consistency, don’t switch strategies every time the market hiccups.
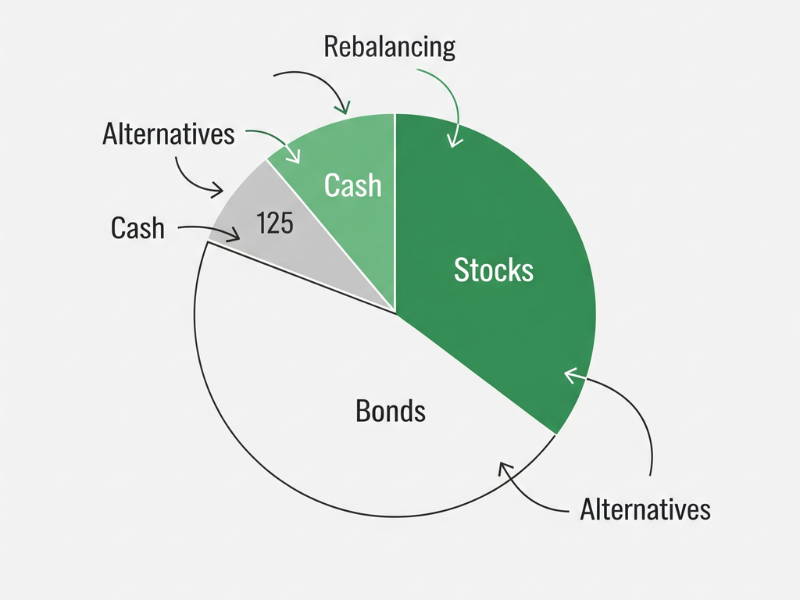
Define percentages for each asset class. For example, you might aim for 60% stocks, 30% bonds, and 10% cash. When I first set mine, I also included a small allocation to alternatives like REITs. Having these targets ensures your portfolio matches your goals, instead of drifting toward risky concentrations.
Tolerance bands are your guardrails. I usually set ±5% around each target allocation. When an asset moves outside its band, it triggers a rebalance. Without this, I once ignored a 10% overweight in stocks, it looked small at first, but it exposed me to way more risk than intended. Bands take the guesswork out of when to act.
Decide upfront how new money and dividends are allocated. I automatically direct dividends to underweight areas and set new contributions according to my target weights. This automated approach keeps my portfolio close to plan without constant tinkering.
Mapping your target allocation and rebalancing bands is like setting the rails for a train. With clear targets, tolerance bands, and rules for new contributions, you’ll stay on track even when the market gets bumpy. For me, it removed a lot of emotional decision-making and made rebalancing almost effortless.
After you’ve mapped your allocations, the next step is planning how money moves in and out of your portfolio. Honestly, this is where a lot of people get tripped up. I used to focus only on growth and completely ignore the timing of contributions and withdrawals, and it came back to bite me when I needed cash during a market dip.
Start by setting up a contribution calendar. I list each account and mark how much I plan to contribute monthly. For me, automating transfers to my 401(k) and brokerage account made a huge difference. Not only does it ensure consistency, but it also removes the temptation to skip a month.
Next, forecast your portfolio income. Include dividends from stocks, coupons from bonds, and interest from cash or fixed-income accounts. I like to be conservative here; early on, I overestimated dividends and assumed they’d cover near-term expenses, which didn’t happen. Estimating carefully gives a more realistic view of your cash flow.
If you’re planning withdrawals, like for retirement or a major purchase, think strategically. I follow tax efficiency rules: withdraw from taxable accounts first, then tax-advantaged accounts as needed. I also prioritize goals, so short-term needs don’t cannibalize long-term growth. This planning has saved me from unnecessary taxes more than once.
Finally, build in a cash buffer. I usually keep three to six months of near-term needs in a liquid account. It’s saved me from selling investments at the wrong time during market drops. For big, planned expenses, I set up sinking funds, separate accounts earmarked for specific purchases. This keeps your portfolio aligned with both growth and immediate cash needs.
Planning cash flows is all about clarity. When you know what’s coming in and going out, you reduce stress, improve timing, and can stick to your plan without panicking when markets move. Personally, having this mapped out has made my investing feel way more under control, and it’s a habit I won’t skip anymore.
Once cash flows are mapped, it’s time to face the reality of costs. I learned the hard way that ignoring fees and taxes can quietly eat away at returns. You might think, “It’s only a 0.5% expense ratio,” but over a decade, that adds up to a serious chunk of cash.
Start by recording every expense ratio for your funds, plus any advisory or management fees. I keep a running total to see how much I’m paying annually. Early in my investing, I underestimated these, and my net returns were much lower than I expected. Seeing the numbers clearly in a portfolio budget statement is eye-opening.
Next, consider potential capital gains taxes. If you sell a fund or stock, taxes can take a bite. I track both short-term and long-term gains separately because the rates differ. Ignoring this can make projected balances look far rosier than reality.
If you trade actively, factor in commissions and bid-ask spreads. Even small costs accumulate over time, especially if you’re rebalancing frequently. I once ignored these costs and realized that my small, “routine” trades had shaved off a few hundred dollars in a single quarter.
Finally, think strategically about tax loss harvesting and asset location. I keep loss-harvesting opportunities in mind when rebalancing, and I assign tax-inefficient assets to tax-advantaged accounts whenever possible. It’s not glamorous, but it improves net returns and makes the portfolio more efficient.
Accounting for costs isn’t just about subtracting numbers, it’s about making smarter choices. Once I started including fees and taxes in my portfolio budget statement, I realized where I could save, where I could shift allocations, and how much more realistic my projections were. It turns abstract investing into something tangible and actionable.
Once your template is set and costs are accounted for, the next step is projecting how your portfolio might behave under different scenarios. Honestly, this is where the statement goes from a static document to a real planning tool. Early on, I used to just assume “markets go up, I’ll be fine,” and that mindset got me nervous during downturns. Stress testing changes that.
I like to run three scenarios: best case, base case, and worst case. Best case might assume markets outperform your expectations slightly, base case follows realistic projections, and worst case simulates a market slump or lower returns. When I did this for the first time, seeing the worst-case numbers helped me build a bigger cash buffer and reduce panic-selling impulses.
Inflation slowly erodes purchasing power, so I always layer in inflation assumptions. If part of your portfolio is in foreign assets, factor in currency risk too. Ignoring these elements early in my planning led to overestimating what I could actually withdraw for goals like vacations or college funds.
For those planning withdrawals, especially retirees, consider sequence of returns risk. I’ve seen portfolios technically hit targets in the long run, but early market downturns caused withdrawals to eat into capital faster than expected. Running a simulation makes it obvious when you need to adjust allocation or withdrawal strategy.
Finally, ensure that cash is available when needed. I always simulate withdrawals for planned expenses and emergencies to see if any account becomes illiquid. Early in my investing, I discovered that one goal’s funds were tied up in bonds with penalties for early sale, good lesson learned.
Running projections and stress tests isn’t about predicting the future, it’s about preparing for it. Seeing numbers under different scenarios gives you confidence to stick to your plan and avoid emotional reactions. My first stress test was eye-opening; it made me tweak my allocations, increase my buffer, and feel way more in control.
After running projections and stress tests, I like to distill everything into a one-page summary. Honestly, it’s amazing how much clarity a single page can provide. Before I did this, I had a dozen tabs and charts, but I’d still feel lost when making quick decisions. Having a concise overview keeps me focused and confident.
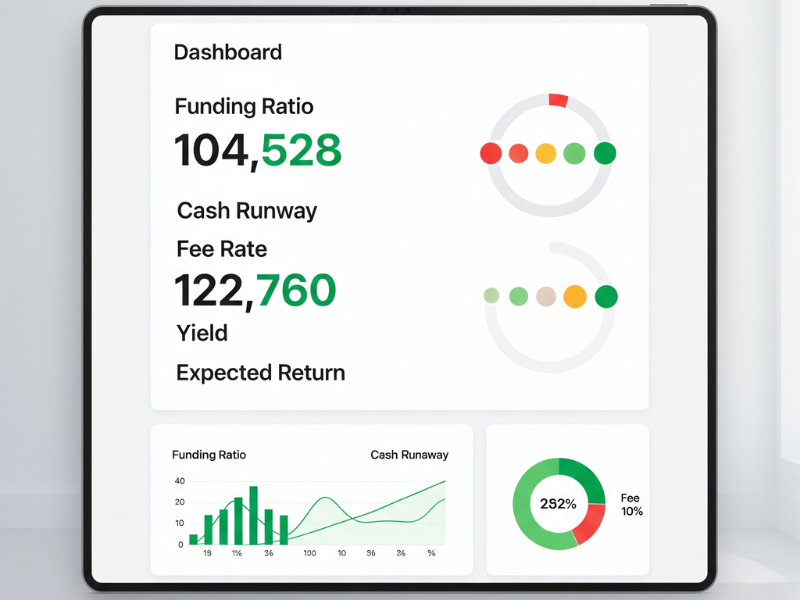
On this page, I track the essential numbers: funding ratio to see if goals are on track, cash runway for short-term needs, total fee rate, overall yield, and expected return. When I first built it, seeing the funding ratio in big bold numbers was a real wake-up call, I realized one of my retirement goals was underfunded and needed extra contributions.
I use a simple color coding system: red, amber, green. If a metric is off target, it turns red; slightly off, amber; on track, green. This visual cue saves me from digging through spreadsheets and helps me quickly identify what needs attention. One glance tells me if I need to rebalance, contribute more, or just sit tight.
Finally, I include a brief action list. Each time I update the statement, I note what to do next, rebalance this fund, increase contributions there, or check an underperforming asset. Over time, this action list becomes a mini history of decisions and lessons learned. For me, it’s invaluable.
Creating a one-page summary turns a complex portfolio into a manageable, actionable overview. It’s like having a dashboard for your financial life. After I started using this, I stopped feeling overwhelmed and started making confident, informed moves. It’s hands-down one of the most useful parts of the portfolio budget statement.
A portfolio budget statement isn’t a “set it and forget it” tool. I learned early on that a plan is only as good as your follow-up. Without a routine, allocations drift, cash needs change, and small errors compound. Setting a cadence for updates keeps everything on track and reduces panic during market swings.
I update my portfolio monthly for contributions, dividends, withdrawals, and fees. It takes me about 30–45 minutes, but it keeps the numbers fresh and accurate. Then, at the end of each quarter, I do a deeper dive: check allocation drift, review performance against benchmarks, and adjust projections. Early in my investing, skipping these reviews led to surprise imbalances, lesson learned.
Every update includes a variance analysis, comparing actual results against projections. I ask myself: Did I contribute as planned? Did dividends perform as expected? If numbers are off, I jot down the reason. Documenting the “why” prevents me from making emotional decisions based on short-term swings.
I keep all updates saved with dates, so I have an audit trail. This comes in handy if I work with an advisor or just want to see how decisions impacted outcomes over time. Early on, I didn’t save versions, and I lost track of adjustments, I vowed never to make that mistake again.
Finally, I archive each version. Every update becomes a snapshot of past decisions, which helps me refine strategies and learn from mistakes. When I look back over a year, I can see trends, spot errors, and celebrate wins. It’s surprisingly motivating to see progress over time.
Updating regularly turns a portfolio budget statement into a living tool. It keeps me disciplined, provides clarity, and ensures that my plan evolves with life changes. Without a routine, even the best statement can lose its value, trust me, consistency makes all the dif
After setting up my portfolio budget statement, the next step is figuring out the tools and templates that make life easier. Honestly, the right setup can save hours and prevent errors. I remember trying to build everything from scratch in a basic spreadsheet, it was messy, confusing, and I made formula mistakes that skewed projections. Using a structured approach changed everything.
I usually recommend Google Sheets for accessibility and easy sharing, but Excel works if you like more advanced formulas. Key tips: use consistent column widths, freeze headers, and color-code asset classes. One time, I forgot to freeze headers and got lost scrolling through hundreds of rows, it was frustrating.
I like to break the spreadsheet into tabs: one for raw data inputs, another for calculations, a third for dashboards, and sometimes a notes tab for assumptions. I also use data validation for asset classes and account types to prevent typos that can break formulas. Trust me, a small typo once cost me an hour of troubleshooting.
For someone still growing their portfolio, I track contributions, expected growth, and long-term allocation. I like to see how monthly contributions and dividends compound over time. When I first did this, I was amazed at how small monthly contributions added up, it’s a real eye-opener for patience and consistency.
For retirees, the focus shifts to withdrawals, sequence of returns, and cash buffers. I simulate withdrawals against projected income from dividends, bonds, and Social Security or pensions. Seeing how withdrawals impact allocations helps prevent running out of cash during a market dip. I remember running this for a mock scenario and realized I needed a bigger cash buffer than I thought, saved me from panic later.
Having the right tools and templates takes the guesswork out of tracking and planning. Once I got a structured setup in place, updating and reviewing my portfolio became quick, accurate, and even kind of satisfying. It’s like turning chaos into clarity, and it makes all the other steps in your portfolio budget statement actually usable.
Even with a portfolio budget statement, it’s easy to slip up if you’re not careful. I’ve made plenty of mistakes myself, and each one taught me a valuable lesson. Being aware of common pitfalls can save you time, money, and stress.
One of the first mistakes I made was assuming the market would always hit my “dream” returns. I projected growth at 10% annually when the reality was closer to 6–7%. It led to overestimating what I could spend and underestimating contributions. Now, I always use conservative assumptions and run multiple scenarios, best case, base case, worst case, to keep expectations realistic.
Early on, I completely underestimated how fees and taxes eat into returns. Ignoring expense ratios, advisor fees, trading costs, and tax withholding made my projections look great on paper but disappointing in reality. Tracking these in the portfolio budget statement is a game-changer and keeps your numbers honest.
Another mistake was failing to maintain a cash buffer. I once planned a home purchase without a proper sinking fund, thinking I could sell investments as needed. A market dip left me scrambling, and it was stressful. Having a dedicated cash buffer for near-term goals prevents emotional selling and keeps long-term plans intact.
Lastly, I used to rebalance based on gut feelings or market hype. That was chaotic. Setting clear tolerance bands and rules for new contributions ensures that rebalancing is disciplined, not emotional. Following rules has saved me from overtrading and chasing short-term market movements.
Avoiding these mistakes makes your portfolio budget statement far more effective. It turns it from a static tracking tool into a proactive, reliable plan. Personally, once I corrected these errors, I felt more confident, less stressed, and more in control of my investing journey.
Looking back, building a portfolio budget statement is less about spreadsheets and more about clarity, control, and confidence. It’s your roadmap for reaching big goals, whether that’s a comfortable retirement, funding college, or finally taking that dream vacation. The magic happens when you combine clear goals, accurate data, thoughtful allocations, and disciplined updates.
By tracking cash flows, costs, allocations, and projections, you can make informed decisions instead of reacting emotionally to market swings. Setting up dashboards, dashboards, and summary pages turns overwhelming numbers into actionable insights. And running stress tests? That’s like rehearsing for the unexpected, it prevents nasty surprises and keeps your plan grounded in reality.
Most importantly, this system isn’t set in stone. Life changes, markets fluctuate, and goals evolve. The beauty of your portfolio budget statement is that it grows with you. Keep reviewing, updating, and learning from the process. Over time, you’ll see not just your wealth grow, but your confidence and peace of mind too.
Remember, investing isn’t just about money, it’s about building a plan you can trust, so every financial decision feels purposeful. Take control, follow your blueprint, and watch your financial journey become far more manageable and rewarding than you ever thought possible.
Want to dive deeper into financial topics? Check out our other guides:
A portfolio budget statement is a detailed document that tracks your investments, inflows, outflows, expected returns, risk, and cash buffers. Unlike a household budget, it focuses on your investment goals and helps you plan for retirement, big purchases, or other long-term financial objectives.
An investment policy statement outlines your investment objectives, risk tolerance, and general strategy, while a portfolio budget statement is more operational. It tracks actual contributions, withdrawals, asset allocations, and projections, making it a hands-on tool for managing your portfolio.
It gives clarity and structure to your investments, reduces emotional trading, and improves accountability. It also helps you plan for specific goals like retirement, college funding, or major purchases by showing how each investment contributes to your objectives.
Monthly updates are recommended for contributions, dividends, and fees. A deeper quarterly review helps check allocation drift, performance against benchmarks, and projections. Archiving versions allows you to track changes and decisions over time.
Yes. By projecting growth, withdrawals, and cash buffers, you can see whether your retirement goals are on track. Stress-testing for sequence of returns risk and inflation ensures that your portfolio can sustain your withdrawals even during market downturns.
Not necessarily. Many investors use Excel or Google Sheets to build structured templates. These allow flexibility, formulas for projections, dashboards for summaries, and easy updates. There are also prebuilt templates available online to simplify setup.
Absolutely. By giving a clear picture of your portfolio, expected cash flows, and risks, it helps prevent emotional decisions during market fluctuations. Knowing that your plan accounts for costs, goals, and contingencies provides peace of mind.
Yes. Whether you’re accumulating wealth, managing a retirement portfolio, or withdrawing income, a portfolio budget statement provides structure, clarity, and actionable insights for investors at any stage.